
How Bad Is It?
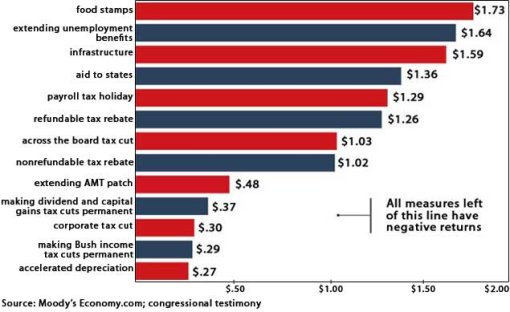
This is a chart prepared by Mark Zandi, chief economist of Moody’s Analytics, hardly a DFH which show the effectiveness of various strategies for providing stimulus to the economy.
Badtux has another chart on his ice floe showing who gets what under the various tax cut plans. It’s a nice chart but it is missing one small piece of information – the Obamapublican plan allows a tax rebate of up to $800 for household making less that $40,000 expire.
Zandi’s chart shows that, as a package, the new plan is actually worse that doing nothing. If you do nothing, the government can afford to actually start pumping some real job-creating stimulus by repairing some the aging infrastructure, and continue to help the state’s through the BAB program.
Thanks to his masterful handling of his job, according to the latest McClatchy-Marist poll, Obama would lose an election to Mitt Romney. He is losing his base by bad-mouthing them, and isn’t gaining any independent support.


2 comments
The DC elites are so freakin’ clueless.
Yeah, I just rather pointed made that suggestion.